Map Catalog for R. Breyer
Monday, September 6, 2010
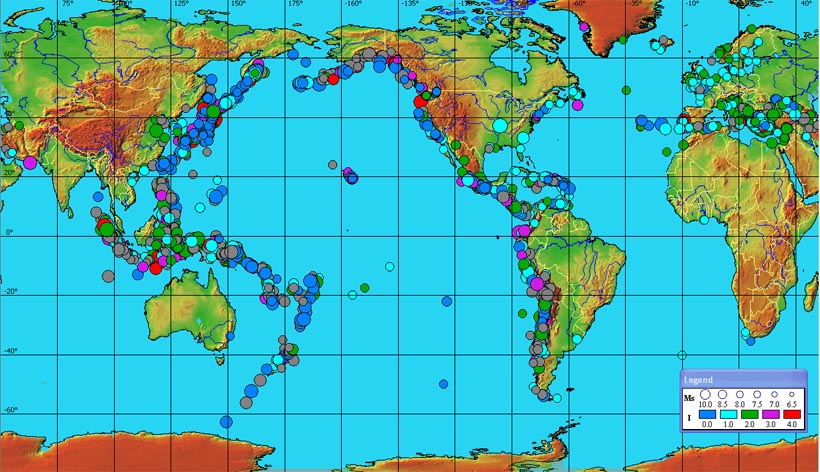
Proportional Circle Map
http://tsun.sscc.ru/hiwg/data.htm
This map shows where tsunamis historically occur. The time frame is 1628 B.C. to the present day. The size of the dot correlates to the magnitude of the tsunami, where the color correlates to the intensity.
No comments:
Post a Comment
Newer Post
Older Post
Home
Subscribe to:
Post Comments (Atom)


No comments:
Post a Comment